A version of this post originally appeared in the September 10, 2020 issue with the email subject line "Pretty data and folk theories of algorithms" and a review of data visualization tool Flourish.
Plenty of other newsletters cover the U.S. debate over Big Tech regulation, so I stay away from writing about those hearings and takes. (To be honest, I don’t really care who owns TikTok, but it would be hilarious if it were Oracle, which is like the Russell Crowe of enterprise software.) But I watch them closely because they’re a fantastic way to learn how the public conceives technology and content recommendation algorithms.
Compared with the general public’s knowledge of how journalism works — not great! — our collective understanding of algorithms is exponentially lower. Since Big Tech feels no need to educate users about their complex products in the name of intellectual property, most people instead believe what academics would consider a folk theory of algorithms. Technically, what I discuss in this newsletter are educated folk theories. The SEO industry comprises educated folk theories since no SEO experts actually work at Google and all current and former Googlers who understand the algorithm are under NDAs.
One of these folk theories may be the centerpiece of a forthcoming antitrust suit against Google, at least according to the NYT: the widely believed notion that tech companies discriminate against conservative media and voices. According to Pew, a majority of Americans believe that social media companies censor certain points of view. The study doesn’t explore whether people feel this discrimination is directly manipulated by humans or algorithmic.
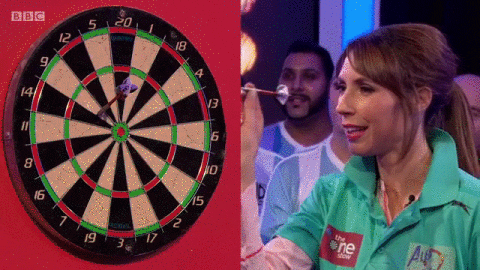
Like all folk theories of tech, these theories of algorithmic censorship are not entirely wrong, but they’re often off-base. They’re on the outer part of the dartboard where the numbers are but technically corked in on the same board as the bulls-eye. (The theories in this newsletter are outer bulls-eye, according to me.)
To understand the reach of these and other folk algorithm theories, as well as to test out a few tools, I pulled some search data to explore the public’s conception of our algorithmic networks.
Why search query data?
Search query data records the exact words that a person types into a search bar. Google and other search engines record and aggregate these terms primarily for advertising, but SEO and content strategists use it as well. The data is completely anonymized — never publicly associated with who typed it. Some search queries are used tens of thousands of times per month, and others are unique.
It’s also wildly revealing, providing in-depth insights on what and how we ask Google about what we don’t know. More than any other type of digital data, search queries reveal what makes us curious at a massive scale. Even though Google’s search share is likely declining as more options become available, most of us still search on a daily basis, across all walks of life. Close-reading the most popular queries can provide an accurate assessment of how the public considers a certain topic.
Master advanced keyword research techniques.
Join More than (key)Words: Audience research for brilliant business-building content, and learn how to research keywords like a pro.
Join the courseFor this dataset I pulled, cleaned, consolidated and organized about 6,000 queries representing 264k monthly U.S. searches using the following tools:
- SEMRush
- Answer the Public
- Tableau Prep
- Flourish
I pulled queries around Google and all major social networks related to the terms “x algorithm,” “x bias,” and “how x works.” I also used the head term “shadowban” in general to see which networks were discussed because I was curious about who uses the word (which I learned from a Stephen Malkmus song) in general.
I’m not going deep into my methodology here because it’s not an academic paper! — but if you’d like more detail on how to organize and pull keyword data, how long it takes, how accurate it is, I’m happy to chat.
Additional caveats: This is part of a larger data project that I’m working on. So this is neither the full nor the only dataset. Mostly it started as a curiosity: how do users think that content recommendation algorithms work? How do they think algorithms are being controlled? How much do they use the search engine they don’t trust to discover whether the search engine is biased?
A few early insights from this work-in-progress dataset:
1. Different channels reveal different levels of sophistication around algorithmic knowledge.
- Instagram users are most likely to talk directly about how the algorithm works, with TikTok users asking more general mechanics questions like “how do I get more likes on TikTok” that don’t directly mention the algorithm.
- Google users no longer search for “how google works.” Users who want to learn more about Google algorithms generally structure those queries around the algorithm or other queries.
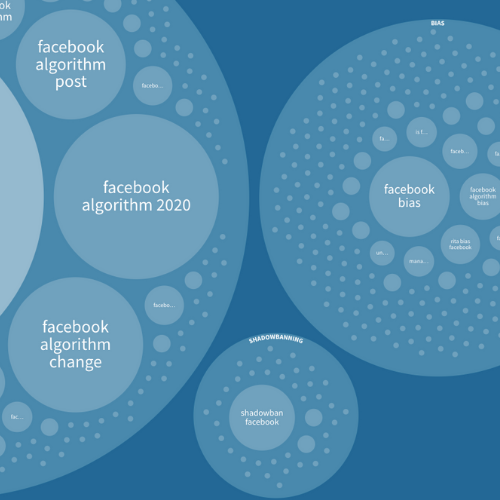
- For the amount of Facebook users, there’s surprisingly little search volume, compared to its sister at Instagram.
- No one asks about the Pinterest algorithm, to a comical degree.
2. Instagram users notice (and panic) when there is an algorithmic change.
Sudden drops in any metrics or visuals prompt queries like “new instagram rule” (6,600 searches/month) and “whats going on with Instagram” (1,000 searches/month). Both Insta and TikTok creator/creative audiences are invested in understanding how those algorithms work and why they are changing.
Compare this withYouTube’s massive creator/creative base, which doesn’t seem to search that much on Google. (FYI, Google’s and YouTube search engines are completely different algorithms and products, so likely there are more searches on YouTube itself about the same issues and many of these queries.)
3. If a majority of Americans believe that Facebook and Google/YouTube have bias or censor some opinions over others, they aren’t searching for more information about why or how that might be.
These search volume wonders are fairly low, compared to other verticals of search queries, and compared to the majority of Americans in Pew’s study. If every query in my study was searched only once by a unique person (not likely), only .8% of Americans would be represented in my dataset.
I trust Pew’s data — and I need to do some more explorations specifically around the word “censor” — so how do we turn concepts of algorithmic and tech bias from a broadcast to a conversation? How do we create trust in our existing social platforms or any other emerging media when we’re starting from a point of both misinformation and mistrust?
And finally, the data itself…
Below is the keyword data, visualized by Flourish, but I’d recommend that you click through to the interactive versions, with five different viz options (and one more artistic interpretation) of the same data. Circles are to scale, so bigger circles indicate more search interest around a specific keyword.
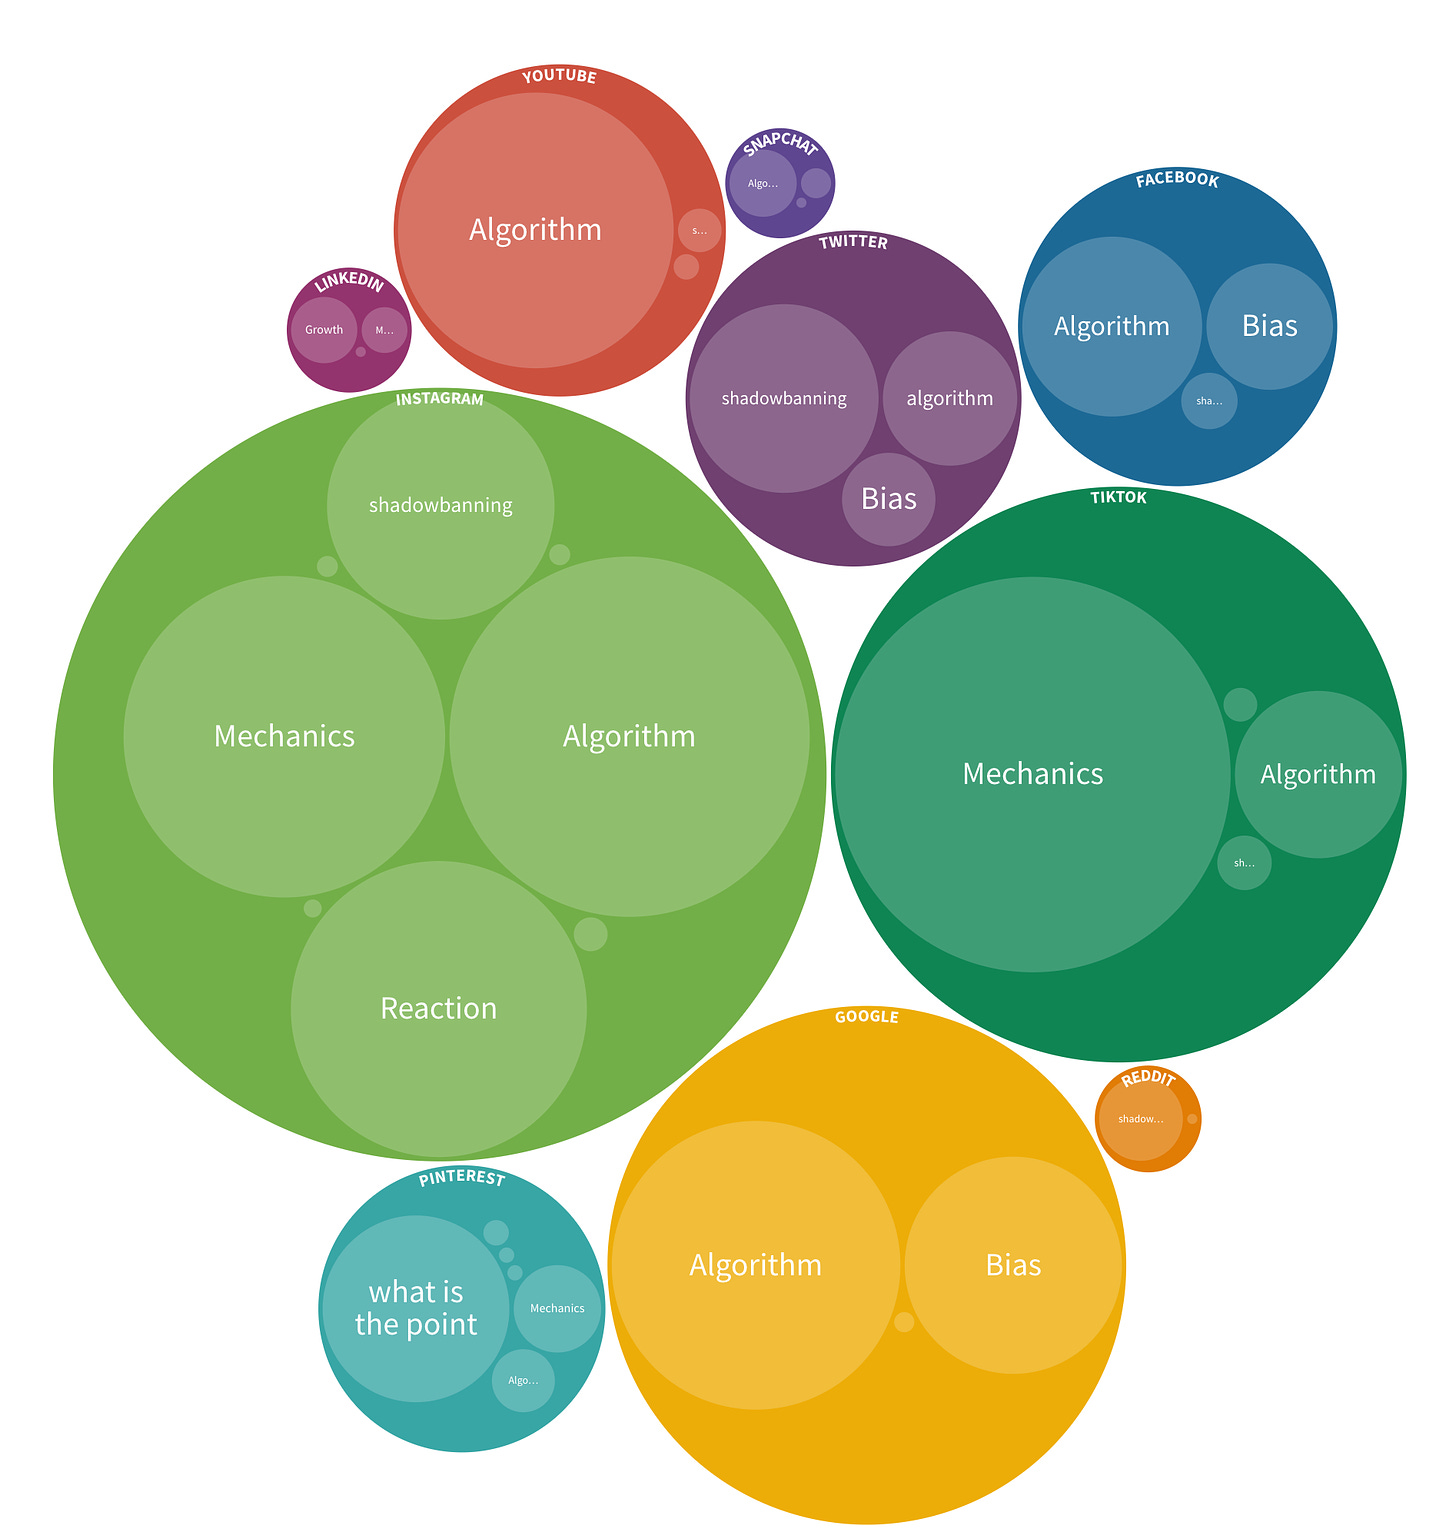
The data kindof makes sense as a static graphic. You can see the more-than/less-than. But in the interactive version, you can hover to understand the totals scale, click into each of the circles to see individual search queries, duplicate and manipulate for yourself, and even check out the raw data if you want to do your own analysis.
And if you’d like this kind of topic research and analysis for your business or content strategy — or if you’d like me to help your team develop a similar data-driven content research process — please reach out. I’m happy to chat.
Hand-picked related content