
Last week we covered why you should think about your content as a resource of audience data. This week we’ll dive into how to evaluate and collect that data as an editor, UX strategist or content marketer.
Can I just use analytics software’s automated insights to manage my data?
If you’ve been here a while, you’ll know that I’m a massive advocate for human-focused and human-conducted data analysis. Analytics software is necessary to run your content operation, but often businesses think that the software alone will solve all their worries.

I’m not saying all of these tools are bad. Many of them are quite good, in the right hands and with experienced human analysts to implement workflows and decipher their results.
But businesses looking to analytics software alone to know whether their customers are pregnant before they’ve told their families — as in the famous NYT article about Target’s marketing* — are likely to be disappointed. Target’s software didn’t violate a woman’s right to bodily privacy and spark unnecessary family drama for the sake of direct mail coupons; Target’s human business intelligence analysts did, likely after significant research and data mining.
Computers are great at identifying patterns, anomalies, highs and lows in large datasets. People are better at describing what those patterns mean in regards to the specifics of your content, the impact they have on your business as a whole, and what action to take.
When it comes to audience data, the most accurate insights come from the data your company has gathered and analyzed on its own, with a deep understanding of the context of how and why the content has gotten there in the first place.
*”Target predicts pregnancy” gets 420 global searches monthly. “Target pregnant girl” gets 180. It’s nuts how much this story is revered in the digital marketing world, when it’s creepy and sexist AF.
Types of audience data
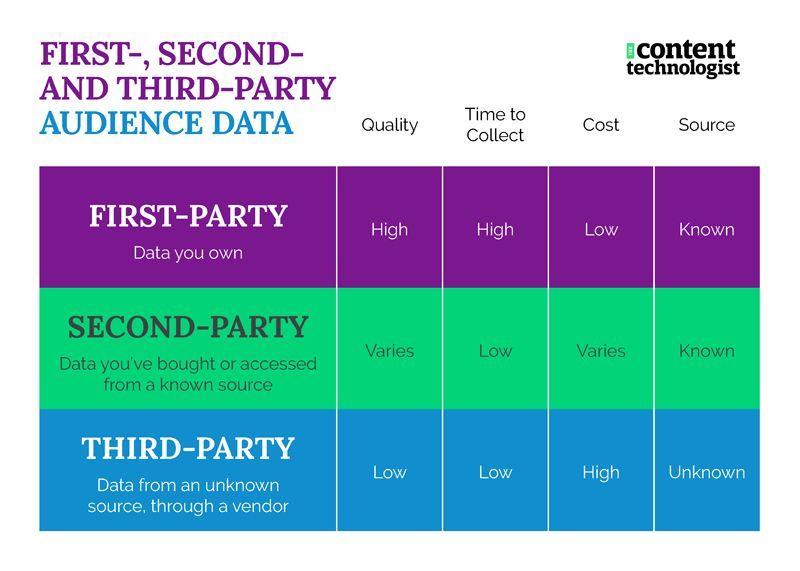
Audience data is everywhere, peddled by martech vendors, publishers and consulting firms, accompanied by jargon on top of jargon and a rising fear of digital data in general. As a brand marketer or editor, know the differences among the data sources and how they’re best used:
- First-party - The data you own, stored in your own database, analytics software hosted on your own website, or customer data platform (CDP). First-party data can be gathered inexpensively, but both data collection and analysis can be time consuming.
- Second-party - Data you obtain from another partner, like lead generation from a co-hosted webinar. As I argued last week, content businesses can use their (ethically collected, opt-in) first-party data as an asset to share with other publishers or business partners, as B2B publishers have been doing for ages. When that data is good, it’s often quite pricey.
Second-party data is sometimes gathered directly from tech companies, like Google’s Keyword Planner or Trends tools, sourced from Google’s search product. If an API is sending data from gathered directly from one tool to connect with your data, that’s second-party data. If you can identify the source of the data directly, it’s second-party data. - Third-party - Data scraped from outside, unknown sources, such as cookies, browser extensions, data warehouses, social listening, user tracking, etc. If you don’t know how or where your source received that data — i.e., sales representatives cannot describe to you in concrete terms where that data came from — it’s third party data.
Third-party data is a catch-all term with some nuance, but with third-party data, users are not fully aware how their data is being collected and used.
I use third-party data for search query research and competitive analysis with an independent SEO tool (Mangools), since Google’s second-party keyword planner tool is nearly impossible to use for meaningful organic research. I rationalize that since the Mangools data is
- collected knowingly (via a search bar aka web form)
- organized and analyzed by a person (me)
- it’s fully anonymized with absolutely no Personally Identifiable Information (PII)
…it’s ethically collected third-party data.* That said, your average internet user probably doesn’t know that folks like me mine their web search terms for behavioral insights. So.

The majority of third-party data sits in opaque databases: relational tables filled with browsing histories, credit scores, home ownership, recent purchases, social profiles, interests, your mother’s maiden name, your first childhood pet, all those ad preferences you opt into, all those you didn’t, forum posts, web content, suppositions about demographics and psychographics. It’s analyzed and redistributed digitally, rarely (if ever) touched by human hands. We don’t see what goes into the black box, and assessing quality or methodology of the algorithms used to generate findings is next to impossible.
Third-party data is sold through publishers and platforms alike, often alongside ad tech or market research firms like Comscore, which I don’t cover but many others do. Any time you hear acronyms and buzzwords like SSP, DSP, OTT, “real-time bidding,” “addressable audiences,” “identity resolution,” or “proprietary dataset,” chances are you’re working with third-party data. Accessing third-party data for audience research is usually expensive, often prohibitively so for cash-strapped editorial and content marketing departments.
![A man reads output printed from a computer, gets a stern reaction from gentlemen in suits, then crumples the printed output out and tosses it in the garbage. [gif]](https://storage.ghost.io/c/ac/fd/acfd0c66-490d-4a75-84b3-c8090897fb78/content/images/2021/01/computer-golden-ticket.gif)
Like understanding primary, secondary and tertiary sources in textual research, audience researchers and editors should understand where their data comes from and how it’s collected to assess its validity.
What first-party data can you use to get to know your audience?
Not all third-party audience data is bad, fast and expensive. Not all first-party audience data is good, slow and cheap.
In my experience with Fortune 500 and startup clients alike,* first- and second-party data that companies collect and analyze themselves (or with a close partner) is far more useful in developing a sustainable content operation than third-party data.
Below are the data sources I’ve found most reliable in developing audience profiles and understanding. These address only your existing audiences -- i.e., the folks who are already regularly reading or viewing your content. These data sets can inform how you both speak to your current audience and attract similar prospective audience members.
**If you’re new here, I am a consultant and have spent the past 9 years working with agencies and publishers in developing SEO and organic content marketing strategies. I speak in generalizations because I can’t share direct client data, and because every client situation is vastly different. But I know some rules of thumb, and I’m happy to share them. I also don’t run paid media, although I advise clients on when/how to incorporate paid promotion into an overall distribution strategy, then send them to a trusted paid media partner for the deets.
1. Their email addresses
If you are running a newsletter, it’s tempting to look at each of your audience’s email addresses and mine data about them from social networks, but that’s 1.) creepy and too surveilly and 2.) not sustainable at scale.***
You can dump your entire content marketing mailing list into a third-party data program like Zoominfo, Hubspot, or other CRM solutions and have them spit out a bunch of random statistics. Or you can dump all of their email addresses into a social network ad campaign database (often called custom audiences) and receive the automated insights designed to assist targeted advertising.
I’ve found data gleaned from these third-party solutions to be wayyyy too general to assist with content planning, especially for B2B. For example, the insights for this newsletter from a third-party or big tech solution might be, “Your audience is interested in new technology.” No shit, Sherlock, the word “technologist” is in the title of the newsletter and I review software. I need more valuable insights than that.
If it’s a requirement that an audience member sign up for third-party sales emails or social media advertising to receive content emails … well, best of luck to your open rates, company reputation and karmic debt. (Looking at you, every publisher that dumps me onto 87 additional mailing lists and the sales database instead of sending me to a preference center when I subscribe.)
If you’re actually trying to build a lasting connection with your audience, especially via email, I recommend that you don’t spam them or misuse their data. You can gather information at scale in other ways that are far less connected to PII (personally identifiable information) like email addresses.
That said, especially in B2B, I almost always look after the @ sign to get a sense of the makeup of your audience. I visit unfamiliar domains from new subscribers’ email addresses because y’all work in really cool places, and I want to understand where you're coming from and what you're working on. Not super scalable and not scientific, but helpful!
***I accidentally went to an audience member’s LinkedIn profile one time and still feel really bad about it. It’s cool to search for your ex’s personal details but leave that stalking out of your audience data strategy.
2. Audience surveys
Surveys are great! I’m into surveys! Survey respondents are often your most engaged, curious, intelligent, and devastatingly attractive audience members. (Please fill out The Content Technologist 2021 survey!)†
All joking aside, the rule of thumb with surveys: unless you incent, very few readers will actually fill out your survey, even if you make it only two questions. If you incent your surveys too much, you’ll likely attract respondents who are most interested in incentives and less interested in your actual content. Surveys are complicated.
The readers who complete your survey will likely be either
- your most enthusiastic fans (stans)
- people who love giving feedback (commenters)
- people who don’t often read but happen to be paying attention that day (randos)
You should listen to and appreciate stans, commenters and randos, acknowledge and plan content according to their responses. But: you also need to acknowledge that your survey respondents are often a small percentage of your overall audience. Lurkers — the 25-90% of your audience that regularly reads and never responds to anything — have preferences too.
Your survey responses will only be as good as the questions asked, and really good surveys take time to develop. Surveys rarely tell the complete story of what your broader audience wants to read or will pay for. Survey data is taken at a single moment in time and reflective of the respondent’s needs on that particular day. Surveys are just one part of the data puzzle.
†Did I use this essay to charm you into taking the survey? Mayyyyybe I did, a little. At least I’m not dumping your info into a third-party database and setting you up for a lifetime of cold-contact sales drip campaigns.
3. Anecdata
Oh, anecdata! Random comments and conversation you receive from readers also contributes to your overall audience intelligence and content planning, especially when anecdata confirms something you’ve already suspected. Anecdata can be a great source of content ideas and new perspectives.
But as anyone who has ever been to a public meeting knows, anecdata can also represent the wishes of the loudest and is not necessarily representative of your total audience.

Anecdata can be that one piece of feedback that sticks with you forever and isn’t even true to your brand or voice. Anecdata can be a great lead onto some new ideas — but always, always corroborate anecdata with something more quantifiable.
Such as…
4. Behavioral and knowledge patterns
What does your audience know? How do they go about learning more?
Web and email analytics are invaluable when it comes to understanding how your audience interacts with your content. Unlike social or search analytics, data collected on your website and through your email newsletter isn’t greatly influenced by algorithms. Your audience is already interacting with your content, reading and watching the experience you designed for them.
Email and analytics data illuminates the topics your readers seek out and return to, and highlights the content that actually drives them to subscribe (or unsubscribe). Understanding what your audience does with your content and how much they know can deeply inform your content strategy. Should you go broad and frequent in your topic selection and publishing schedule? Or dig deep and publish less often? (Or somewhere in between?) Does the audience who found your content via organic search have different needs than subscribers from earned media? Which content styles attract subscribers and encourages people to log in?
Now for the drawbacks: Significant setup time and digital analytics expertise precludes harvesting valuable insights from web and email analytics. If you don’t know the difference between a metric and a dimension or how to read a heat map, you’re going to have a hard time setting up a more complex segment or behavioral analysis.
Content also must be structured so that you can track behavioral and knowledge patterns accurately and consistently — usually through CMS tags, website structure, content groupings, or email database segmentation.
Many analytics suites, including some features of Google Analytics, require you to set up custom metrics and dimensions before you can track content or audience groups. It’s not always difficult, but it is time consuming and often requires collaboration with a data scientist or developer, depending on your organization.
But don't get hung up on the segmentation. Marketers can get caught up in endless segmentation and analysis paralysis, so my advice is always: start simple. Pick one of the following dimensions and start tracking in email or web, then go broader:
- Content departments/topics/pillars - What posts or emails are most successful in each? Do you see differences in how topic pillars are consumed?
- Content type - How do different types of content affect behavioral patterns? If you embed a video or list a TL;DR at the top of the page, do readers scroll to access the rest of the content or follow links to another content type?
- Acquisition medium - How does organic search user behavior differ from email subscribers? Does paid media attract a different kind of traffic than referrals? Do any of these media have topic preferences?
- Device - Are there differences between how content is consumed on mobile vs. desktop?
5. Interactive content and forms
Interactive content and forms are less formal than surveys, and usually embedded into your website content or email. The latter category also include on-screen chat widgets, and is fairly straightforward in design or collection. Users get in touch when they want to contact you.
Interactive content is more complex, usually a quiz or game — some sort of intentionally designed interaction with a content-focused incentive. Good interactive content requires creative collaboration among visual thinkers, storytellers and creative programmers, weaving in publicly available data, game design or just creative thinking.
Think The Pudding, Ceros originals and Buzzfeed quizzes (esp their editorial quizzes pre-2019): Interactive content experiences don’t even need to give the audience member a result if they’re built for creative engagement. But good analysts can always learn from interactive behavior: how do different behavioral patterns emerge in content designed for novelty?
Like surveys, responses to interactive content and forms are a moment captured, easily swayed with emotion and/or functionality. Quality interactive content is also a deep creative investment, since we’re all very used to web and social quizzes in 2021. Novelty and perceived value of the result make an impact on whether your audience trusts you with their results to begin with. (And again… opt-in and privacy notices are imperative for a healthy audience relationship.)
Both interactive content and forms can be used to understand your audience’s preferences long-term, including how they change over time.
What should editors and content marketers do next?
Figure out where your data and assumptions are coming from. Audit your data sources if necessary. Identify your core collaborators and resources. Then, plan, collect and analyze!
Yes, it’s much harder than it sounds. But next week — for paid members only — I’ll explore a few common data stories to look for and how to meaningfully report to your higher ups.