
This essay originally was published on July 7, 2022, with the email subject line "CT No. 130: Your data will change. Here's how to take benchmarks."
The data we use to measure content success is changing, rapidly, and most businesses are not remotely ready. Privacy regulations in Europe, antitrust actions in the United States, and self-regulation from tech giants have already affected the types of data that can be collected for audience digital behavior. Shifting metrics include:
- Complete organic keyword data - hasn't been fully provided in either Google Analytics or Google Search Console in about 10 years
- Email open rate - rates universally rose when Apple changed privacy settings in its email last year
- Bounce rate, unique pageviews and almost everything tracked with the old version of Google Analytics, to be retired in July 2023: reconfigured or completely removed from Google Analytics 4
Trackable data on digital channels will continue to shift as tech giants and governments alike make changes to improve end-user privacy and limit the amount of trackable data that individual companies are able to collect. In my view, these changes are good, contribute to more ethical digital business operations, and shouldn't make a dent the data that supports your content strategies.
Content strategists collect and interpret data to understand what attracts and resonates with their audiences as an aggregated group. Data affected by privacy regulations, often tied to individual identifiers like email or IP addresses, shouldn't affect the evaluation of aggregate content performance.
Open rates, Apple's privacy changes and "unreliable" data
In September 2021, Apple launched iOS 15, which included additional measures to protect user privacy from unnecessary surveillance from advertisers and businesses. The change dulled the individual effectiveness of email tracking pixels, so Apple Mail users would no longer send signals to advertisers and sales teams when an email is opened. As a result, email open rates went up across the board, since Apple Mail programs recorded more emails as automated opens than before.
When a big change like Apple's email privacy updates goes live, and metrics like open rate shift from their previously established norms, some digital professionals throw up their hands and argue, "None of the data is reliable anymore!" That's not true, and anyone who says that doesn't understand digital measurement.*
When dealing with a major shift in data availability or if you're just starting to measure for the first time, the best way to stay on track is to re-benchmark your data. Understand that the data will change with new regulations, and that there are new changes coming. If you take before-and-after benchmarks from the data change, you'll be able to adjust your strategies to accommodate major shifts in available data.
What are content analytics benchmarks and why are they important?
A content analytics performance benchmark is:
- The average performance for a single metric on a single property over time
- A temperature check for your content's baseline performance
- Unique to your business (i.e., not an industry-wide comparison)
- The easiest way to understand how your content is performing and your audience is growing.
Benchmarks set the baseline for your owned content performance, establishing which numbers are typical and which are improvements. If strategists don't take benchmarks at the beginning of a content project, how will they know that the content has improved once the strategy is in place?
Digital content data is directional, meaning that the conclusions a strategist draws from data are one factor in a multi-tiered editorial approach. Taking benchmarks from your owned data helps you access more bespoke direction to create content that's likely to succeed in digital spaces.
Setting your own benchmarks helps you develop long-term sustainable content strategies, the kind that improve 5-10% month over month and inspire audience loyalty. instead of relying on outliers or guesses, benchmarks help content teams understand when they are on track and when they are missing the mark.
*All of these reports are available in GA4 but with a completely different setup (that I haven’t entirely figured out yet). I’ll publish recommended content flows once GA4 becomes more common, and I've used the tool enough to gain confidence.
What data should you benchmark?
With the proliferation of digital metrics, you can go hog wild benchmarking and find no real insight. But to laser focus on what will help your content succeed, I recommend starting with the following types of benchmarks:
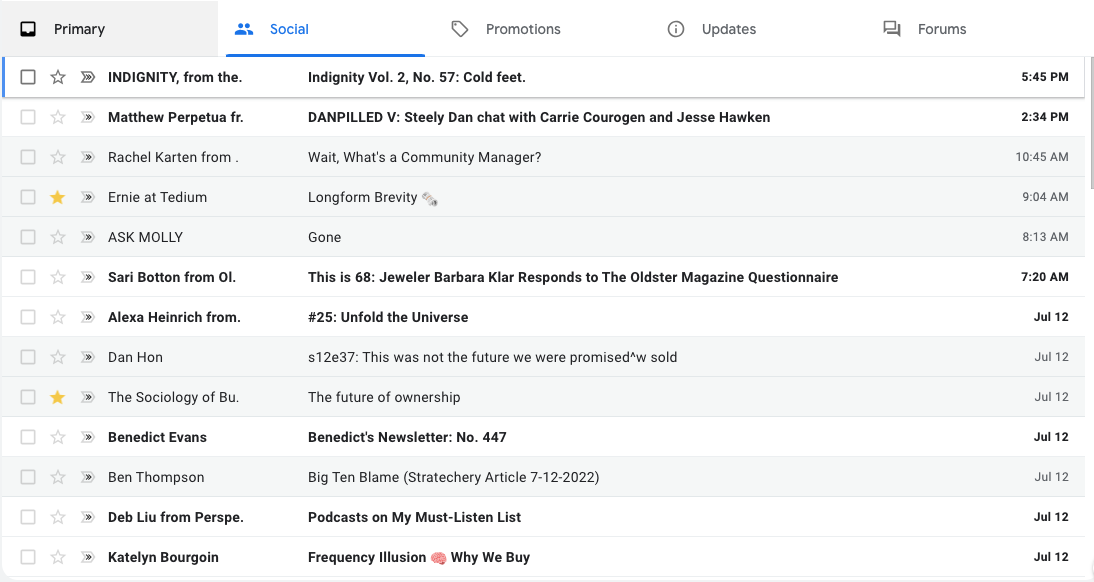
- Visibility: indicates that your content has been seen by users (e.g., open rate, sitewide organic impressions, social reach)
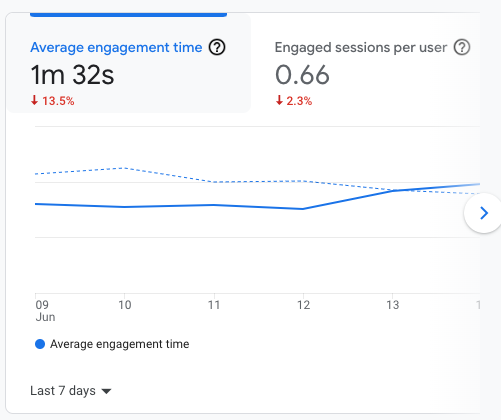
- Engagement: indicates how your audience is interacting with your content (e.g., session duration, WAU to MAU, clicks on email links, traffic to website from social and email, social engagement metrics)
- Conversions: indicates how many audience members purchased a subscription or signed up for a newsletter in a given period (usually a custom analytics set up)
If that's too theoretical, start with: Monthly unique sessions on your website (traffic), average email open rate, and the number of new email newsletter subscriptions you receive in a month.
Steps to take a content performance benchmark
- Select your metric. I recommend choosing a KPI or other metric that you consider important for understanding your content business. It can be your email open rate, absolute number of email opens, monthly average users or average monthly total sessions.
Because we're talking about email open rate, I'm going to use email open rate for the example here. - Note your dimensions. Dimensions describe metrics: date ranges, locations, specific segments you're tracking, or specific types of content. Note dimensions for all your settings, For the purposes of this demonstration, we're going to look at email open rates on a weekly basis. I send an email regularly, weekly, so this is the easiest way to track change over time. I'll also note that I'm looking only at my total open rate, so I'll exclude issues I sent to my paid-only or free-only audience segments.
If I were taking a benchmark in a Google Analytics property, I'd probably use a monthly timeframe, since weekly can be more challenging to calculate. - Gather three to six months of data from before the major change. To understand the impact of Apple Privacy changes on my email open rate, I'm going to examine the open rates from April to September 2021, six months before the change took place.
Here's my email open rate data for my selected date range
| Issue number | Open rate |
|---|---|
| 76 | 40% |
| 80 | 43% |
| 84 | 44% |
| 87 | 45% |
| 88 | 43% |
| 90 | 40% |
| 92 | 42% |
| 93 | 39% |
| 95 | 39% |
My average open rate for the six months prior to Apple's privacy change was 42%.
4. Eliminate atypical data and outliers. For example, if you had a mega viral hit that caused one post's traffic to skyrocket, or if you had problems with a specific email your ending up in spam folders and lowering opens for one week, you'd want to eliminate them from your benchmark. Benchmarks take your sustainable average or baseline, not your high or low point.
For this particular dataset, I've eliminated data from Apple's initial rollout period in late September and early October. Apple mail's privacy changes rolled out with the release of iOS 15 on September 20, 2021, and it took a few weeks for users to fully adopt IOS 15. I picked up with the 11 issues beginning November 4 to see how the Apple's mail privacy changes affected my open rates.
I'm also eliminating the lowest and highest weeks in each data set to get closer to a benchmark average baseline.
5. Collect the data from your after period. Compare with your before.
| Issue number | Open rate |
|---|---|
| 101 | 47% |
| 106 | 38% |
| 107 | 51% |
| 108 | 52% |
| 110 | 45% |
| 112 | 52% |
| 113 | 53% |
| 114 | 48% |
| 118 | 51% |
My average open rate for this period is a 49% open rate.
Because my audience growth has been steady and my open rates relatively consistent as this newsletter has grown, I just assume that the Apple Privacy padding is 6-7% for my newsletter. If I want to compare 2022's open rate behavior to previous years before Apple's privacy changes, I'd make sure to figure a bumper of 6-7% in my open rate comparisons.
How I used the email open rate to understand my long-term content success
For example, when I compare the 6/16/22 newsletter's open rates (50%) to the same week two years ago (6/18/20, 42%), I'd say that my open rates are steady, despite a 215% growth in absolute audience members.
That's a good thing, since open rates decline as your audience grows larger, so a steady open rate is about as good I can expect. (If your open rates are going up over time as you gather more subscribers without the Apple Privacy bump, congratulations on finding and engaging your target audience.)
If I went by the industry estimations of the Apple Privacy change, reported as 10%, I'd be adjusting my averages too high.
Calculating average rates can be tricky, especially if there are wide variations in your audience size. If you started with 50 subscribers and ended up with 50,000, the above benchmark methodology isn't going to be super accurate. But if you're tracking steady organic growth over time, your email open rate benchmarks should be pretty accurate.
If you are looking at this and thinking, wow, she just took a bunch of averages and that's basic elementary school math, you're right! It is. It's astounding how much a little bit of basic data collection and spreadsheet-assisted math can support a good content strategy.
Hand-picked related content