

In the past two issues, I’ve covered the why and how of first-party data collection and understanding your audience. Now it’s time for some practical details: common content engagement data patterns for both web and email.
A few notes on method and my web analytics stack
I am a Google Analytics (GA) power user, and in my opinion it’s absolutely necessary for a content business to use GA as a baseline analytics tool. It’s free to use and learn. Adobe Analytics works as well, although it’s a far bigger investment (but if you work for an Adobe shop you often have no choice).
Some privacy-focused web analytics alternatives are on the market, but they don’t provide the robust and multilayered data of Google Analytics, which content analysis requires. If you’re a direct-to-consumer company with no content marketing arm just looking to move e-commerce products, one of those web analytics alternatives might be fine. If you are running a content business, you need more robust reporting capabilities to understand how people engage with content and not just purchase subscriptions.
If you are concerned about privacy, you can run Google Analytics on your site and not turn on the ad or data sharing features. You do not have to share your website analytics data with Google.
(If you are one of those people who starts with the assumption “Google is lying about its data sharing with Google Analytics,” I don’t know what to tell you. Maybe let’s talk? But in good faith and deep experience, you can use GA and still be privacy-minded. If they're lying, it's on them.)
If you’re interested in content analysis and don’t understand a word of the below tips, I’d recommend that you invest some time in an advanced certification in Google Analytics. It’s free! (Yes, that’s where they get you. Yes, it’s big tech. I still recommend it.)
Technical considerations for content analysis
This overview concerns Universal Analytics (UA), the classic GA setup that you’re likely still using. Google Analytics 4 (GA4) was released last year, but most companies haven’t switched or are still running UA concurrent with GA4.*
Setup for all scenarios: Set your dates in Google Analytics to look back at a year’s worth of data. If you don’t have a year, do a quarter or six months. You need at least a quarter’s worth of data for this analysis to be useful.
For the intent of understanding lurker engagement, we’re going to use above-average pages per session (PPS) as our barometer. It’s a default metric in GA, so even if you don’t have event and conversion tracking set up, you can still follow along. Typically greater than 3 PPS is considered highly engaged for most content businesses.
As with many enterprise software programs, GA offers several methods to filter data that ultimately achieve the same result. I typically use segments and predefined tracking where I can, but for the purposes of this piece, I’m adding screenshots of GA’s training wheels, the advanced filter report. That way, you can make yours like mine.

If your business hasn’t, take time set up conversion and event tracking to make your data even more closely tied to business results. Some guidelines are at the bottom of this email. PPS is a great starter metric for measuring engagement, but subscriptions and conversions actually drive revenue.
*All of these reports are available in GA4 but with a completely different setup (that I haven’t entirely figured out yet). I’ll publish recommended content flows once GA4 becomes more common, and I've used the tool enough to gain confidence.
1. Opportunity to increase reader interest: Look for low traffic, highly engaged pages
Just like every woman has a freakum dress, every content-focused website has these sexy little gems hidden deep in their analytics, waiting for their big night on the town.
- Start with your landing pages report. In GA: Behavior > Site content > Landing pages.
- Sort by Pages/session.
- Filter out any page with less than 10 sessions (click Advanced > Exclude less than 10 sessions).
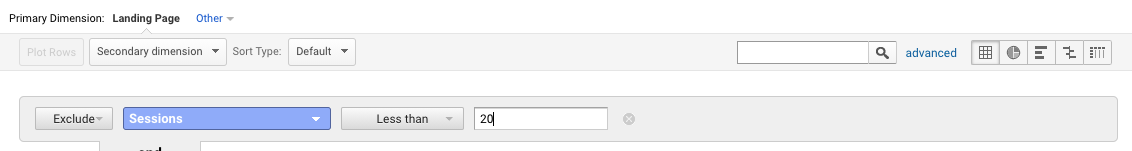
Output: low-traffic landing pages that drive higher than average user engagement. Users like these pages, but they’re often buried in favor of the tacky glitter of viral high pageview counts
Insight prompts: What do you notice in common about these pages? Are they all coming from the same directory or the same type of topic? Do they attract new users or returning users?
Recommendations: If they are extremely low traffic, how can you surface these pages to show them off to more people? Should you optimize them for organic search better? Add to links from your homepage or other high-traffic pages? Socially promote?
If you’re a pro: segment and compare high engagement landing pages from organic, direct, referral, and (to a lesser extent) paid traffic. What do you notice about the types of content over time?
2. Understand the growth rate of frequent readers: inspecting direct traffic
When audiences regularly read websites, they bookmark or type the URL directly, a behavior tracked in GA as direct traffic. Typically direct users are already familiar with your brand and value your content.
Good digital media and content marketing websites experience a steady growth in direct traffic over time. It means that users are visiting the site regularly and seek out your content outside of search.
- Start with the channels report: Acquisition > All traffic > Channels
- Click on Direct traffic
- Make sure that your explore graph is set to monthly, especially if you are analyzing a year’s worth of data. I also like to set the graph to Sessions rather than Users in classic GA, so we’re consistently looking at the same metric.

Output: a graph that demonstrates how direct traffic — users who seek out your brand’s content without help of a search engine — has grown over time, as well as a list of top landing pages for direct traffic.
Insight prompts: Is there any seasonality to direct traffic (i.e., does it correlate more to gift-giving seasons)? What’s your average growth rate month over month? Did you experience more direct traffic when people were seeking out information for COVID-19? How much of that direct traffic landed on your content or category pages vs. your homepage?
Recommendations: A solid growth rate for direct traffic would be 5% month over month. If you’re well-established, your growth rate will be much lower than that. If you’re well-established and your direct traffic is declining, you have detective work to do. If you would like to grow direct traffic regularly, I recommend that you move away from putting all your content marketing in a giant directory named Blog.
If you’re a pro: Benchmark session duration and PPS for direct traffic and look at how both have changed over time.
3. Learn how readers are familiarizing themselves with your brand: isolating repeat organic visitors
Before audiences bookmark your site, they’re often organic returning visitors. They’ve visited your site several times from organic search and are getting familiar with your brand and your content. I think of these folks as pre-lurkers. Defining pre-lurker numbers will help you forecast who can potentially convert into a reader.
- Add a segment to show only returning users. Just below and to the right of the date, above the chart, to the left of the main menu. Click the plus sign, apply your segment, and rearrange like so.
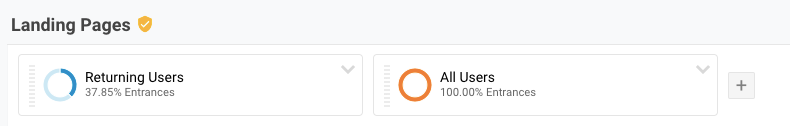
2. Visit the landing pages report again: Behavior > Site content > Landing pages
Output: A list of landing pages common to returning visitors, aka people who have been to your website before.
Insight prompts: Are there specific types of pages that returning users visit when they find you again through organic search? How do those pages compare with those that new users visit? (Make another segment for new users if you want to go deep.) What can you infer about your users’ preferences after they’ve visited your site through organic search a number of times? At what point will they convert, either to subscribers or direct users?
Recommendations: Start understanding the behavioral differences and benchmarks of new users vs. returning users, particularly from organic search. Repeat organic search visitors are building a relationship with your brand. How can you improve it?
4. For all you newsletterers out there: checking immediate open rate
I’m just starting to watch this metric, especially since the new cadre of newsletter platforms is highly focused on watching stats climb in real-time. For those of you interested in building an audience, keep an eye on your immediate email open rate.
What is an immediate open rate? Within the first two hours of your send, what percentage of your users have opened your email?
I’m always surprised at the number of you who open this email the second it hits your inbox. I often put even my best-loved email newsletters off until later, so I get all the internet dopamine feels when I see that 25-30% of you open the email in the first two hours after sending. (Do you actually read it in the first two hours? I think so? Or maybe you scan and save for later… no way to tell, and I don’t need to know that many details.)
Traditionally, email marketers don’t look at open rates after they’ve sent emails, or at least not in the hour or two after sending (they’re just breathing sighs of relief that they didn’t have to re-send the email). It’s only during reporting that individual email metrics are scrutinized.
When email newsletter platforms combine with the unnecessary thrill of real-time analytics, you can watch your email open rate climb immediately after sending. Sure, some immediate open rate timing depends on when you send and where your audience is located… but it’s a fun metric to watch. It’s a good “hey, they give a shit!” metric.
Conversion and event tracking for content engagement
Google defined how we create and measure digital marketing with conversion tracking, which enables businesses to measure user actions immediately before the point of purchase, rather than making guesses based on ad placements. I could extol the virtues of conversion-based marketing vs. impression-based marketing for hours, but, yeah, another essay, another time.
Regardless…
All analytics suites are borderline useless if you don’t track core business actions. Core business actions = conversions. Conversions can be directly tied to revenue. In content businesses, conversions can be:
- Subscriptions, free and paid
- Member log-ins
- Form fills (leads generated) from gated content
- Purchases of any kind
- Quiz or interactive content completion
Engagement actions, which are often tracked in analytics suites as events, include:
- Above-average pages per session (as above, PPS)
- Above-average time on page
- Likes, claps, comments, share button-pushes
- Clicks to related content or other pieces in a series
- Video plays
- 75% or more scroll depth*
- Intent but not completion of a purchase or login
The above are all on-page actions — so organic and paid search visibility metrics (impressions and clickthroughs) don’t apply. Additional analytics tools, like conversion rate optimization and heatmapping, can provide further, deeper layers of on-page analytics. There are essays, courses, textbooks to be written about all of the above… but hopefully these GA tricks are enough to get you started in analyzing the patterns in your content performance and converting more prospects to subscribers.
If you are seeking help in deciphering your company’s content analytics or would like an overview of your analytics set up and content measurement process, let’s collaborate.
Hand-picked related content