This essay originally was published on April 20, 2023, with the email subject line "CT No.164: Social media content preventive care."
When was the last time you thoroughly analyzed your social media stats? And I mean, not just glancing at the numbers, but diving deep. When’s the last time you looked into what kinds of content draws higher engagement rates, assessing if your posts are reaching your ideal audience, and really understanding what the numbers say about your content and business performance?
Just like going in for a health check-up, putting off monitoring social media analytics isn’t going to make unfavorable results go away. Regular maintenance prevents larger emergencies. If you don’t routinely check in on your social media performance, you’ll likely have to make time for damage control in the future.
Can’t remember when you last took a look at the numbers? Then today’s the day for our social media health check-up.
What social media health stats should you look for?
Not every measurable metric will provide the best picture of your social media health. Individual metrics on their own are rarely useful until they are cross-compared with other data, or monitored over time.
For example, your follower count doesn’t necessarily indicate success. A brand can have 10,000 followers, but if they're all bots or users who don't care about your brand, that number seems less glamorous. But authentic follower growth from real, engaged people — that’s what you want to watch out for.
If your business is focused on audience growth and brand affinity, the key stat to watch is engagement rate. Engagement rate measures your total engagement (the sum of likes, comments, shares and saves) compared to your follower count. To calculate your overall engagement rate,
- divide your total engagement
- by your follower count
- and then multiply by 100
Calculating your engagement rate for each channel will determine where you stand among your followers. Reaching a million eyeballs isn’t very helpful if the audience doesn’t stop to view our content. In social media, we want to boost engagement with authentic likes, comments, shares and saves as an indicator of users’ interest in our brand.
The same goes for calculating the performance of a post. Zero in on engagement rates per post, compared to average performance, to determine what types of content (short form video, photos, carousels, etc.) resonate with your audience. Find your per-post engagement rate by dividing the total engagement of the post by its reach.
Not every measurable metric will provide the best picture of your health. Individual metrics on their own are rarely useful until they are cross-compared with other data, or watched over time.
How often should you check in on social media analytics?
The short answer: a minimum of once a month, but not every day.
A routine social media checkup identifies how your content is progressing. Ideally you’ll be checking weekly or at least every other week, but the prescription for health is never one-size fits all. For example, if you only post once a week, monthly would be best.
Checking too frequently may get you hung up on minutiae. Checking your analytics after each post is like Googling your symptoms when you feel a cold coming on. If you hyperfixate on one small symptom, you might think you’re sick with a deadly disease… when all you have is a headache.
Don’t let daily performance overwhelm you. Much like weighing yourself, results can fluctuate day-to-day. Most content businesses are more concerned with how long-term performance relates to business goals. Focusing on the analytics insights of today’s Reels won’t make or break social media results, but taking stock of Reels analytics month-over-month is a valuable snapshot of how your content affects your audience and your business.
Tracking social analytics with an old-school spreadsheet
Yes, we have access to a fair amount of social media data built into each tool, but native social media platforms offer a limited lookback window, like 30 or 90 days. Three months of data at a time isn't enough to get a clear picture of your social media health. Remember that it can take six months or more to see significant growth with a consistent strategy.
Here’s what we advise: create a spreadsheet to track your brand’s social media analytics for long-term performance. (It’ll also impress your boss; trust us.) Compare your engagement rates for each channel, and watch your audience grow over time with month-over-month follower growth rates. The longer you put it off, the less insight you’ll have into social content performance.
What should you include in your spreadsheet? Keep a record of the metrics below for each platform, with an eye on engagement rates and month-over-month follower growth rates.
Pro tip: Set a reminder in your calendar to update this analytics spreadsheet regularly. It may seem tedious, but you’ll need those analytics reports months down the road once they’ve disappeared off your dashboard. Then, make a note to thoroughly assess your stats at the end of each month, each quarter, and each year. If you’re working with a team, be sure to share those results!
Social media analytics to review: Instagram, Facebook and TikTok
You might be nervous about what you’ll uncover. Before the fear kicks in, remember that your assessment could determine that your social media performance is incredibly strong. For example, I was recently hired to do a check-up with a client who had never looked at their analytics and feared they were awful. We were happy to uncover just how shockingly healthy their social media accounts were.
Even if you don’t find the results you’re looking for, once you track your progress, you have nowhere to go but up. So here are some basic metrics for each platform to get you started on your social media benchmark journey:
Instagram analytics
Location: Instagram Analytics are available on desktop or mobile, but you'll get a deeper analysis if you use the Account Insights on your Professional Dashboard within the Instagram mobile app. Once in the Account Insights section, review performance based on posts, Reels or stories specifically.
Date range: The Instagram standard data window is set to the last 30 days, but can be adjusted to any time within the previous 90 days.

Upon opening your dashboard, you'll be greeted with three key metrics:
Accounts reached: How many people are seeing your content? Reach doesn’t mean your audience paid attention; it just means at some point you popped up on a feed. Think of it as a billboard: Accounts reached is how many people drove past, whether or not they bothered to look up.
Accounts engaged: How many users stopped to see what you had to say? Instagram factors in several Content Interactions into their engagement stats, including:
- Post interactions (likes, comments, and saves)
- Story interactions (replies and shares)
- Reels interactions (likes, comments, saves and shares)


Track your analytics by content type to assess how your audience interacts with posts vs. stories vs. Reels. Screenshots from Instagram analytics by Emily Rochotte.
Unfortunately, these numbers are often inflated with bots, so benchmarking your own key engagement metrics over time will provide a grounded view.
Track your analytics by content type to assess how your audience interacts with posts vs. stories vs. Reels.
Total followers: How many people are following your account? Again, we take this number with a grain of salt, knowing it could be inflated, but it’s worth tracking your month-over-month performance.
How to determine engagement rate: Calculate total engagements for each post type over the total number of accounts reached. It’ll help you understand how effectively your content is reaching your audience over time.
Facebook analytics
Location: Open up your Facebook mobile app, where you’ll find more analytics details (including video view counts) than you will on the desktop equivalent.
Date range: Facebook’s window of trackable history is a very brief 28 days (smaller than Instagram — yikes!). If you plan to monitor your analytics monthly, you might want to consider logging into Facebook every other week to pull your results.

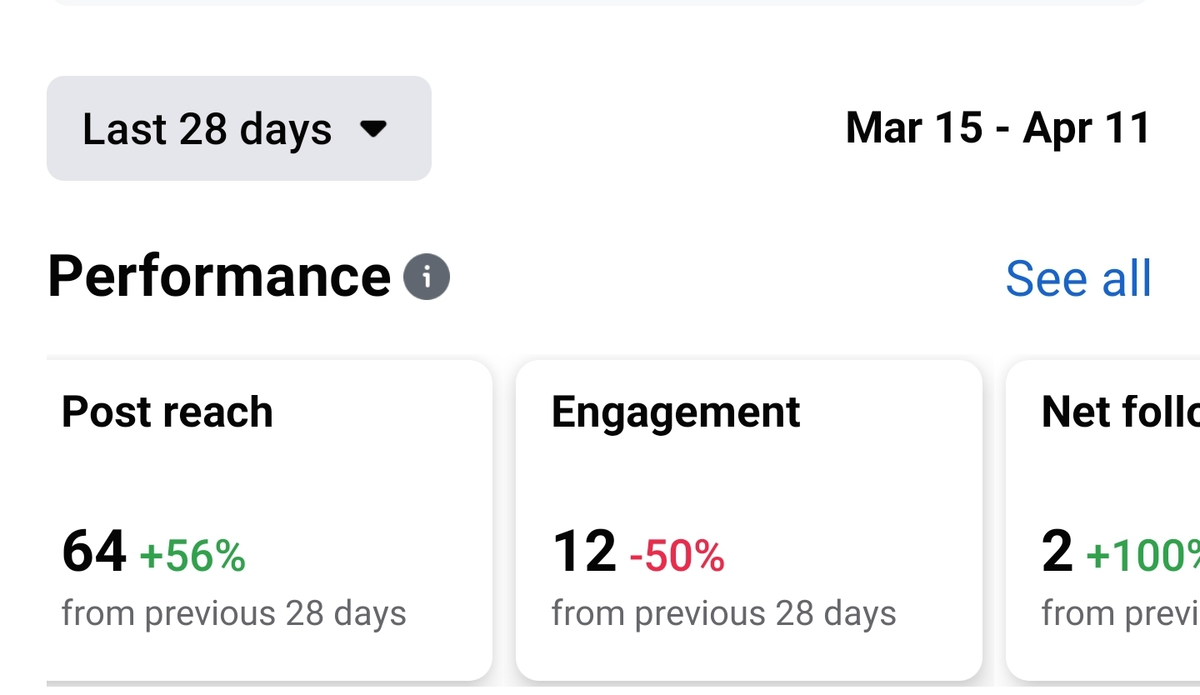
Follower count: We hope you understand this one by now, but it’s a measure of how many people actively went out of their way to like your page.
Post reach: Similar to Instagram, reach measures how many people saw your post in their feeds. It’s akin to the “impressions” metric in advertising or organic Google search.
Post engagement: Who is reacting to your content? Unlike Instagram, Facebook doesn't include saving a post as an engagement, but all the emoji reactions, comments, and shares are counted within Facebook’s post engagement metric.
Video performance: Only available with the Facebook mobile analytics interface, you can assess user retention on views of the first three seconds of a video, and if viewers continue watching past the minute mark.
How to determine engagement rate: As with Instagram, calculate the number of engagements divided by total reach.
Meta Business Suite
Location: For a broader, side-by-side overview of Facebook and Instagram analytics, head to the Meta Business Suite. Unlike the mobile versions of each app, the Business Suite view displays previous years’ data, but doesn't show as much detail for individual post insights.
Median likes and comments: Remember “median” from math class? It’s the midpoint—not the average—of all posts during a specific window of time. This metric can be skewed with outliers if you only posted a few times, or if you had a post that went viral once.

TikTok analytics
Location: Under the Analytics section of TikTok Business Center, you’ll find insights similar to Instagram and Facebook for tracking reach and engagement.
Date range: TikTok provides up to 12 weeks of historical data.
Views: For TikTok, “views” are more akin to Facebook’s “reach” or ad “impressions.” It means that the video was technically in a user’s feed, even if they swiped past the content after one second. If the content is so engaging that a viewer replays it a few times, an additional view is logged each time the video restarts.
Reach: TikTok’s metrics run differently than Facebook’s, with “reach” meaning that someone actually watched or engaged with a video.
How to determine engagement rate: Compare how many times your video reached people to how many times it was viewed. A higher view count in relation to reached audience means that your content was relevant enough to the viewer to watch it again, or that it played in the background as they went to share their thoughts in the comments section.


Screenshots from TikTok's analytics interface by Emily Rochotte
Conversions: TikTok offers additional insight on lead generation, profile views, and download link clicks through organic and paid posts… although as of our April 20, 2023 publication, the analytics interface appears to be in flux. Whether TikTok is removing or improving these conversion metrics remains to be seen.
Third-party social media analytics software
With so many readily available metrics built into social media apps, any social media professional can run a healthy, growing account using the data each platform provides.
But if you’re looking for a second opinion or want a deeper assessment of your social media performance across multiple channels, look to third-party tools like Sprout Social, Hubspot, RivalIQ, Brand24, or BuzzSumo, to name a few.
Third-party data can give you more advanced details compared to native platform analytics, including trending topics, advanced social listening, hashtag performance, engagement rate calculation and additional insights that can be used to create and track social media campaigns.
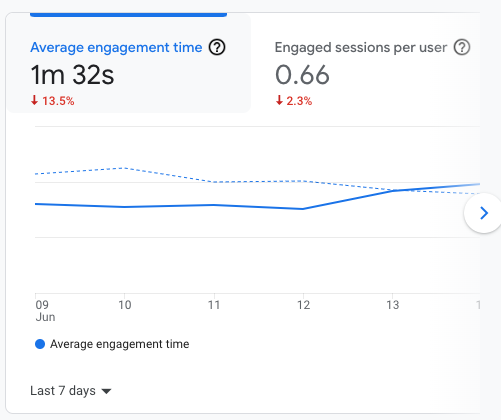
Google Analytics 4
While Google Analytics is not a social media analytics tool specifically, the release of GA4 has come with some new features that allow for an in-depth analysis of which website traffic arrives from social media. Compared to the previous version of GA, where social media was treated as an afterthought, GA4’s automated interface separates both organic and paid social traffic from referral or paid media channels.
How to use your social media health stats
Didn't get the results you were hoping for during your check-up? Take a deep breath. You will likely see improvement moving forward. The good news is that you now have the data you need to create a strategic growth plan.
If your engagement isn’t where you’d like it to be, try altering your content pillars. Think about posting educational content users are enticed to save for later. Directly engage your audience with calls to action in your captions. Consider how you can more authentically engage the audience on social platforms themselves.
If you’re trying to grow your follower count, dive into which types of posts most often attract new followers. What topics engage your current audience, and which draw in new users? Note both content type and topic, and consider calculating engagements for each.
Using your social media data for brand growth
Too often, businesses use social media with the main purpose of driving traffic, generating leads, inspiring purchases, or other website-based goals. Of course, more web traffic and sales are ideal; who wouldn't want a post on Instagram to convert into millions of dollars in sales? But social media posts are about far more than a “link in bio” call to action to drive web traffic.
Instead, focus social media efforts around building awareness over time. When you boost engagement with valuable content that meets the needs of your audience, you’re showing your audience that they can trust your brand to create content they enjoy.
For the sake of your mental wellbeing, remember that no digital data is 100% accurate, and social media attribution is notoriously challenging. A consumer could have seen your content 15 times on TikTok and built their entire perception of your brand on that channel, but if they buy from a link in your email, that email often gets credit for the sale. Don’t assume your social media isn’t working if you can’t directly track every conversion back to a social platform.
To help you track more accurately, social platforms will sometimes give you a heads up when they change their algorithms or measurement calculations. Regardless, you’re at their mercy to trust reach and engagement numbers.This can feel especially frustrating when bots and spam accounts are inflating your visibility numbers. That’s why you benchmark with your own data rather than comparing with other accounts: you’ll have a good sense of what authentic engagement looks like when you watch the progress of your own social analytics.
Considering social media as a brand awareness tool rather than a conversion-driver takes the pressure off making our every post convert. Continue to track social media health month-after-month, let the analytics guide your content creation, and watch your health improve. Getting into a social media checkup routine will keep your brand healthier and your social media content more appealing to your audience—all while proving to the powers that be that social media has a business impact.
Hand-picked related content