

When I chat competitive content strategy with clients, I advise: make your own content as engaging as you can before even glancing over your shoulder at competitors. There's not nearly enough well-written, comprehensive web and email content out there, so if you're armed with a solid product, audience research and a unique perspective, your competitors don't stand a chance.
But healthy competition is a motivator. As much as I tell myself, "Stop comparing yourself to others," it doesn't always apply to client work.
The quality of data from competitive analysis digital marketing software is questionable and expensive, so I don't subscribe to tools that promise in-depth competitive analytics. Traffic estimates from third-party sources (SEMRush, SimilarWeb, ComScore, Alexa.com (sunsetting in May)) rarely reflect the traffic data in an owned analytics platform. You can use third-party traffic metrics for scalable comparison—i.e., a competitor gets 2x the traffic of your site—but the numbers are estimates at best. They're also becoming less reliable with improved digital privacy measures.
To evaluate competitors' content strategies and success, I've developed a four-point competitive scorecard that provides clients with just enough data to understand how owned organic content performance compares to similar sites.
This scorecard uses free or low-cost data from established sources that are unlikely to change with the death of third-party cookies and additional privacy regulations. These metrics are based on public or easy-to-acquire search data, apart from the surveillance advertising ecosystem.
The caveats, as always
- All digital metrics are slippery. All digital metrics are subject to bot fraud and manipulation. Seeking exact accuracy in digital metrics—or any business metric that is not revenue—is a fool's errand. That said, these scorecard metrics are more useful when comparing competitors or a single site's performance over time.
- The best source for traffic data is always your owned analytics platform, whether it's Google Analytics, Adobe, Matomo, Volument, Parsely or something else.
- Benchmarks work best in times with "typical" data behavioral patterns. 2019 was the last predictably "typical" year, although web behavioral patterns have significantly stabilized since the rollercoaster of 2020.
The competitive scorecard for content-first websites
Easily accessible quantitative performance metrics for publishing people
To develop your scorecard, I recommend selecting a competitive set of 4-6 other websites that represent variety within your industry.
You'll likely want to gather metrics for the following, based on your understanding of the competitive set:
- The biggest competitor in revenue or company size
- Your most similar competitor in size or content strategy
- The competitor with the strongest brand or perceived authority
- A competitor who shows up frequently in organic search for the same or target topics
1. How well does the general public know your brand? The power of brand search volume
Brand search volume describes how many people, on average, search on your exact brand name in a given month. I've written before about using Google Search Console data to understand brand lift after PR campaigns. However, GSC is only available for your own website, so to understand competitive data you'll want to use another source. You can either use:
- Exact search volume through a keyword research tool (I use Mangools, a paid SaaS tool, but you can find decent free keyword research tools out there)
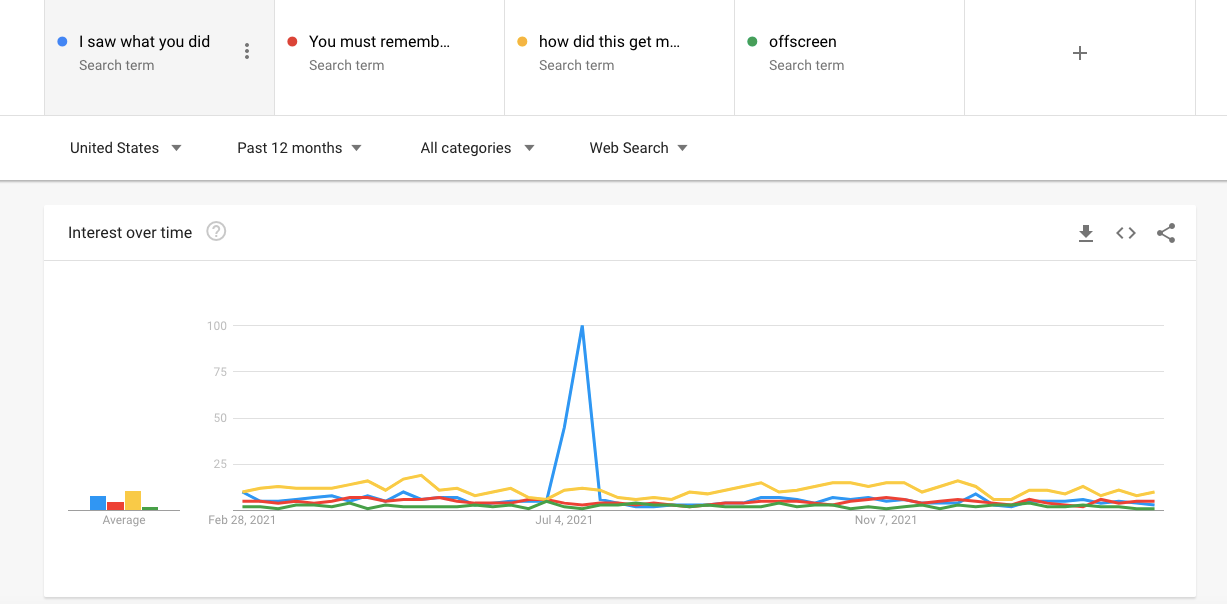
- Comparative search volume on Google Trends. Trends only provides data on a scale of 1-100, rather than exact search volume, but it can pull up to six competitor terms into a single graph for a nice visual. Or, you can export the metrics for a scalable comparison.
Brand search volume measures brand awareness. The more people who know your brand, the more often it's Googled. It's a harder metric to discern if your brand's name is a common word (like Pitchfork or Chapstick), but you can usually find a modifier ("Pitchfork music," "Chapstick brand") that signals a brand intent search.
 Deborah Carver
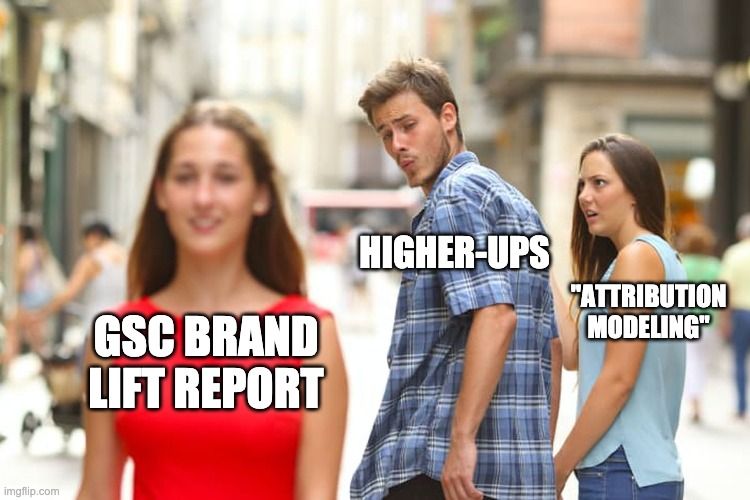
2. What's your brand's existing search equity? Understanding Domain Authority
Domain Authority is a metric developed by Moz (and copied in other search visibility tools) that measures how much a website is perceived authoritative by search engines. Domain Authority is primarily determined from the number of backlinks from other authoritative sites.
So, if you're a website, receiving a link from the New York Times (DA: 95) or the Mayo Clinic (DA:91) means your authority will increase in the eyes of Google. Some in the SEO industry call this authority transfer "link juice" (gross), but it's more like a tacit seal of approval that results in domain authority.
Different industries have different DA benchmarks. For example, most SaaS websites hit a DA in the 40s-50s, while local news websites can range from the 50s to the 90s.
I trust Moz's data more than almost any other SEO-focused tool, in part because they've committed so much of their business to SEO education and transparency. Domain Authority is derived from Google's published papers and thought leadership.
The best part of Domain Authority: it's available free through Moz's Link Explorer or the MozBar.
The worst part of Domain Authority: some leaders see it as the end-all, be-all metric of search performance, but it's not actually Google's data, so technically it doesn't have any impact on Google. It's more like a mirror of Google data. Hypothetically, one could increase a website's Domain Authority and not increase organic users or traffic or ranking or anything else. That's why we're using DA in conjunction with other metrics, because single metrics never tell good stories.
Deborah Carver
3. How many other websites care enough to link back to your content? Assessing linking domains
Backlinks are the foundation of search engines and remain a major part of search engine optimization. I could write pages about good vs. bad backlinking practices, but for the purpose of a competitive scorecard, we only want to understand the comparative volume of backlinks.
Anyone who has ever evaluated a backlink profile will tell you: all kinds of crazy websites will link to yours, and often you'll have no idea why. Suddenly you'll have backlinks from thousands of domains you've never heard of, all because you've been publishing content regularly.
My time-saving advice: Don't chase down every domain you see in the link explorer. You will not find much substance. Check the total number of links or linking domains, check out how competitors perform, and you'll have an idea of where your site stands. (If your site has been flagged for toxic backlinks, that's another problem, but that's rare in the 2020s.)
When evaluating against competitors, you'll likely see stark differences among competitors in backlinks. Competitors with more backlinks tend to have stronger organic performance overall, usually because their backlinks have been gainfully earned through public relations and great content and not supported by shadier methods.
Any comparative backlink metric works in a competitive scorecard, as long as you're consistently pulling the same metric in the same timeframe, but I stick with linking domains because it's slightly less easier to game.
I use Moz's Link Explorer to gather this metric, which is freely accessible for ten uses per month with a Moz account. (I'm rarely building more than one scorecard monthly, so the 10 free Link Explorer searches are enough for me.)
Deborah Carver
4. How much content is on your competitors' sites? Establishing website size
The final metric I check when developing a competitive scorecard is the number of pages discoverable by search on a competitor site. The rule of thumb: bigger websites perform better in search because they have more content and more authority. It's "of thumb" because of frequent discrepancies between search performance and content. Many large websites have very little content. Since most of my clients are content publishers, site size determines how much content their competitors are publishing in comparison.
The easiest way to assess site size is to use a crawler like Screaming Frog, which has a free version that can crawl up to 500 pages. Most content websites are larger than 500 pages, so I use the paid version of ScreamingFrog. I report the site size as the number of 200 code responses (301s and 404s don't count as real pages).
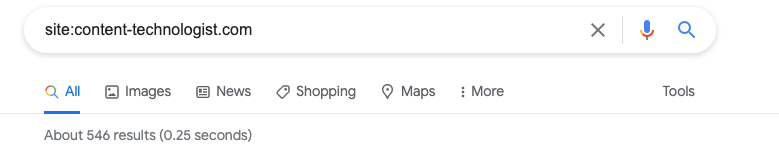
If you don't want to pay the annual fee for ScreamingFrog (worth every penny tho), you can assess website size for free by using the "Site:" modifier in Google for any root domain. Unless your competitor is blocking significant content from organic search, you'll get a solid estimate.
 Deborah Carver
Finding a story in the competitive scorecard
So what do these scorecard numbers mean? After gathering your data points, you'll want to find the data stories. Here's what I look for:
- Are the biggest sites always the ones that are most linked or most authoritative?
- Are the sites with the perceived best content the most linked or authoritative?
- Does brand search volume reflect domain authority, or are these two metrics inconsistent among competitors?
- Which metrics are surprising to you, considering the competitive set?
- How do competitors' linking domains and domain authority compare with your own?
The more scorecards you create, the clearer the stories will become. You'll find that sites you've identified as top competitors don't perform as well as you expected. You'll start to recognize how much "good" varies among different industries. And you'll realize that great content doesn't necessarily mean a commanding domain authority, particularly if that great content hasn't been adequately linked or promoted.
Happy grading!
Hand-picked related content
Deborah Carver Deborah Carver
 Deborah Carver