
I'm sheepishly writing into the CMS today, like a tween returning to her neglected diary, hoping to "knock a post out" before I hop back over to client work.
I've tried a couple of times to knock out a big theoretical post, but nothing wound up coming together, so I just whined about it on LinkedIn.
In the meantime, since I'm not making a course on the topic this year, I figured I'd share my content-specific measurement approach, a riff on the "consumer journey" or "funnel" measurement model many companies use.
Enjoy it, send your feedback, and if you use it as a starting point or share with your team, feel free to exuberantly credit The Content Technologist. I haven't the gumption to properly make the concepts intellectual property, but bully for me, in the U.S. "copyright protection exists from the moment an original work is 'fixed' in a tangible medium," so hey! Writing it down is literally the least I can do.
And if you're in the U.S., please make a plan to vote! Preferably for a viable candidate who doesn't aspire to be a dictator!
–DC
Performance tracking for content teams: The Content Technologist Measurement Model
When I first made the transition from publishing to marketing in the early 2010s, everyone was talking about the McKinsey Loop, originally published in 2009. At conferences and client presentations, experts declared, "The funnel is dead! Consumers use multiple touchpoints!"
Ten years later, other experts are still urging marketers to rethink the funnel, which feels a bit like a Middle Ages Church schism, wherein some of the population believes in funnels and the other half believes in loops, and then there are the Postmodernist folks who are all, "All truth is relative, and we can't trust human behavioral models built primarily on the research of a small sliver of one cultural population."
Regardless on where you stand of funnels vs. loops vs. clouds or whatever, this measurement model is designed to assess human behavior as it relates to digital content consumption. It has five areas, which are depicted as a funnel-like or loop-like progression.
I see them more as five different species of bees with different behaviors and needs... buzzing around in hives and going about their business... but every now and then one bee chooses to evolve to the next bee.
Never mind the metaphors. None of them work.

But you know what does work? Measuring your digital content consistently so you can track performance, visualize progress, and make better decisions.
How to use a content measurement model
Content measurement is complicated. The role of content in a business model varies, and the value of content shifts from one business to another. I've written about this before, but generally:
- In media business models, the content is the product, against which advertising or subscriptions are sold. In mass broadcast communication, content is free to the consumer with its production supported by advertising. In reader-supported communication, media businesses need to attract paying subscribers to make the business sustainable. Media business models can be nonprofit or for-profit (but, as someone who lives in the home of nonprofit media, the business structure doesn't matter much in the day-to-day production of content).
- In tech and service business models, content supports the product. Whether the content is developed to market, sell, or maintain relationships with the customers who buy the product, content performance is not the primary driver of business performance. As many of us have experienced, some software companies have brilliant ancillary content and mediocre products and vice versa.
- In educational or cultural business models, content floats somewhere in between. For museums, libraries, foundations, university, and nonprofit organizations, educational content is central to the organizational mission. It may be directly endowed or subsidized, but it's not the main driver of revenue or business value, which is most often focused on organizational reputation, philanthropy, and donor development.
As content professionals, we need to be able to discern whether our content works regardless of the business model. Our role is to produce and structure content to affect business outcomes, but whether content is a product or plays a supportive role should not affect how most of us measure whether the content is successful. (If you rise to an executive level, understanding of the business model becomes far more essential, but for most in the digital content mines, the business itself is not the primary focus.)
Each stage in the model offers multiple options for measurement. You can track them all, or just choose one or two metrics in each stage that are most important to your team. Not all are intended to be key performance indicators, but each metric below can provide meaningful input for content decision-making.
To encourage consistency in the primarily qualitative field of content production, The Content Technologist Measurement Model is designed to work across all three of the above business models or any hybrids you might encounter. It's structured to help content professionals make better decisions about what to do with content in any business.
For the most part, the measurements below are quantitative because digital content distribution channels and businesses run on quantitative data. Algorithms measure various aspects of content performance based on mathematical calculations. So do the investors and the finance team.
I always go back to the Modest Mouse lyric:
The universe works on a math equation that never even ever really even ends in the end.
While humans make decisions based on emotional and qualitative judgments, in the end our brains, the markets, and physics function on mathematics. I don't pretend to understand quantum physics, but I know that if I can't prove content's value to an organization on the math machine in front of me, I don't have a job.
What role does attention play in content measurement?
In contrast to many of my very smart peers (whom I clearly respect!), I fundamentally reject the idea that we are living in an "attention economy." Why? Because we cannot accurately measure human attention.
We've all been children listening to a lecture or been on bad dates wherein we stare into someone's eyes and nod our heads as the content goes in one ear and out the other. We know how to perform the actions of paying attention when we aren't attentive in the least. We know about second screens and multitasking and the art of maintaining our sanity in a world that continually demands that we look at bright flashes and shiny objects while attending to our own and others' needs.
And in my feminist perspective, I fully believe that the focus on an "attention economy" doesn't properly acknowledge the negative consequences of too much attention, which many people (primarily women) face on a day-to-day basis. We want to be seen and heard, but we do not want the kind of attention that leads to cultural judgment or, at worst, physical violence.
Functionally, at some level we can track eyeball movements and maybe even brain patterns, but I don't believe your organization will hire an EEG or fMRI technician to run studies that determine whether your content is effective. In venture capitalist terms, attention doesn't scale.
As many of us already know, attention does not keep a business running. Money does.
That's why this model is built on human behaviors we can actually measure with our computing machines: time spent, actions taken, and transactions completed.
All that said, the below is a model, and no model is perfect.
Understanding dimensions for content measurement metrics
The below represent the groups of metrics that determine whether content is effective. But all metrics need to be paired with dimensions to properly understand content performance.
Dimensions describe metrics so we can determine the stories about human behavior embedded in our data. Dimensions can be mixed and matched to tell more complex stories, and the more dimensions we add to analysis, the more nuanced our analysis becomes. Not all dimensions are meaningful for every type of analysis.
In content measurement the most effective dimensions are:
- Time series: How does a metric change over a day, month, quarter, or year? Typically, I recommend that against measuring daily performance, since content is a long-term relationship builder.
- Content type: How does performance shift based on the format of the content? Are certain types of information more effective in long-form videos or short-form text blurbs?
- Content topic: Does performance vary based on the content's subject matter?
- Context/channel: Does content perform better in one environment versus another?
- Location/country/culture: Does content perform better in certain geographic locations?
How does this model differ from ecommerce or marketing measurement models?
Demographics, psychographics, personas, and predetermined "funnel stage" (i.e., TOFU/MOFU/BOFU) tend to be superfluous in understanding content's effectiveness and can lead us to make poor judgments about other humans' behavior.
Take it from someone who has been asked to "map funnel stage to content assets" many times, then thrown out the labels because they provide no meaningful distinction: you never know just how someone will use a piece of content, but as long as it's providing measurable value to your ideal audience, it's often worth keeping around.
Because content is sometimes the product and sometimes supportive of a product or mission—and sometimes all of the above—this model highlights measurable behaviors in a funnel-like motion without implying direct relationships between them. It also removes channel specificity, so it can apply to most distribution strategies.
Audiences might eagerly jump to the commitment stage after awareness, or they could repeatedly engage on social networks but never sign up for an email or visit your website. Pre-assigning content assets or social channels to behavior assumes more about audience behavior than any brand is able to know or track.
Finally, this model does not directly mention revenue except for in clearly revenue-driven transactions. In every business that works differently (although Lauren Lang has shared some great ideas about content-to-pipeline revenue in lead gen businesses).
Visibility: Can audiences and algorithms find my content?
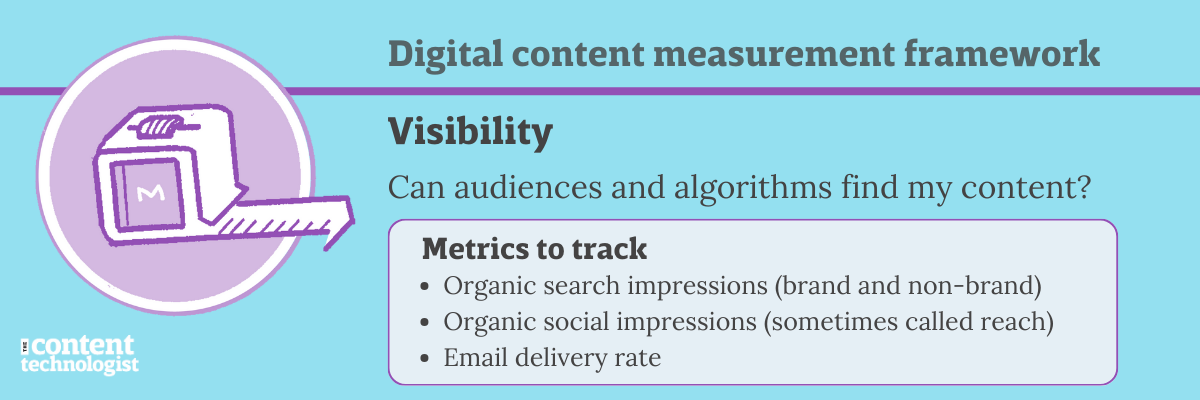
Visibility determines whether audiences are able to find your content in recommender feeds and inboxes. It’s the only stage that measures algorithmic performance over human actions. While human actions directly and indirectly influence visibility metrics, the Big Tech powers that be don't share those actions willingly.
Think of visibility as creating content to be distributed via the post office. If the postage isn’t adequate or the packaging doesn’t hold up in transit, your intended audience won’t even see it.
Visibility metrics can also be bought, quite easily, through paid advertising. But in the organic, non-paid content world, understanding whether your content holds muster without promotion can save quite a bit of money.
I recommend measuring the following to determine visibility:
- Organic search impressions measure your website’s potential to appear to audiences in organic search. Unlike paid impressions, these cannot be purchased.
- Brand impressions represent how many times your brand name has been directly searched on Google and can double as a measurement of brand awareness.
- Non-brand impressions represent how often your website content appears in search on terms unrelated to your brand name. They are the best metric to determine the topics where your website has the most potential to build authority in algorithms.
- Delivery rate measures whether your emails are reaching your subscribers’ inboxes.
- Social media organic impressions represent how often your social media content appears in social feeds. On Meta social networks, organic impressions are described as reach.
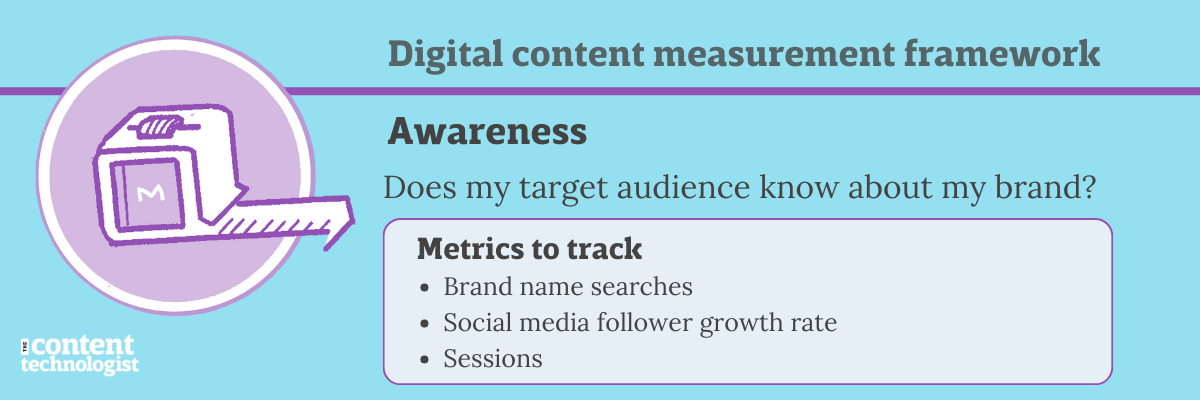
Awareness: Does my target audience know about my brand?
Awareness metrics measure whether
- your potential audience knows that your brand exists and
- seeks your content on a surface level.
Awareness metrics don't necessarily determine whether people care about your content, but it does indicate whether people know your brand is creating and publishing content.
Awareness and visibility should be measured separately. Awareness is a human acknowledgement of content's existence, while visibility can be impacted by many things, including technical errors. If you don't have visibility, you likely don't have awareness.
I recommend the following to understand awareness:
- Brand name searches represent how often your brand name is searched or mentioned each month, as calculated by media monitoring software, Google Ads, Google Trends, Google Search Console, Bing Webmaster Tools, or other tools that track brand names.
My one wish for AI tools is to be able to track the number of times a brand is mentioned either in a prompt or in a response. Realistically I don't know that we'll ever get that information. - Social media follower growth rate represents the rate at which how many people actively opt in to potentially see your brand’s content on social networks (technically, followers can also be bought, but that practice is frowned-upon).
Take note: many social networks don't track follower growth over time (hello, LinkedIn), so you have to note this one manually or with another tracking tool. - Sessions measures the number of times users access your website within a determined period. A session in Google Analytics expires after 30 minutes of inactivity. Users can have multiple sessions, but if a user views the same page several times in one session, that page is only counted for one session.
Engagement: Does my target audience interact with my brand’s content?
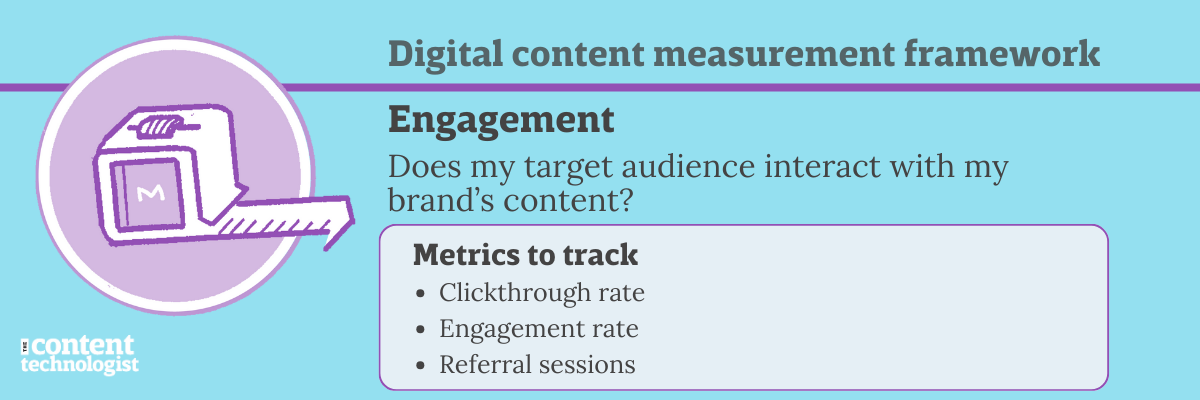
Engagement metrics measure whether your potential audience cares enough to click through or interact with your content.
It’s not a full commitment, but engagement metrics mean that your potential audience saw your content in the wild and responded to it.
Many social networks rely primarily on engagement metrics to determine visibility, but that doesn't mean engagement should be a primary goal of content. It's a leading indicator of good content performance, but people engage with clickbait, rage bait, and, all kinds of other content they don't care about or like in passing.
Many people, like me, will engage with someone's social media post simply because it inspired a chuckle or drew a second glance. LIKE. HEART. ACCIDENTAL DOUBLE TAP. Does that action mean I'm going to back their Kickstarter, subscribe to their newsletter, or buy their product? Absolutely not.
Recommended engagement metrics are:
- Scroll rate represent how often sessions on your website result in scrolls through 90% of your content. For websites that post long text content, the scroll rate measures how often users are reading a full piece of content or article.
- Clickthrough rate represents the rate at which people who see your content on search engine results pages (SERPS), in your email, or on social media channels click through to your website.
- Engagement rate measures the rate of users who actively interact with your content to the number of users who saw your content in the feed.
In GA4, an engaged users clicks on more than two pages, interacts with the page by filling out a form, or scrolls through 90% of users. The new GA4 metric is the inverse of what was previously called bounce rate.
In social media channels, the number of engagements represents the number of click reactions, comments, or shares relative to the number of the time the post was seen in a feed. - Referrals from other websites or social media channels represent the number of sessions on your website that result from social media post or profile views.
- Direct feedback from casual users. Tools like Dreamdata and Rockee.io
Because most of the above are rates, they are easily impacted by the amount of content posted as well as algorithmic visibility. Engagement is not a business-critical stage for any business model (except social networks with algorithmic content feeds, for whom engagement is a sign of attention). Tracking how rates improve is generally an acceptable ballpark measurement of "Is the content mattering on this channel?"
Commitment: Does my audience want to commit to or pay for my content?
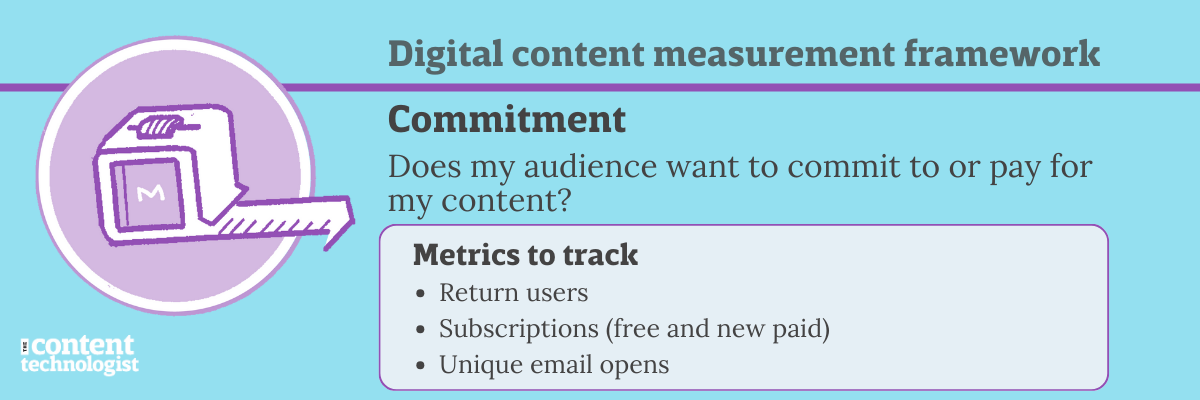
Commitment metrics measure whether your potential audience commits to receiving your content on a regular basis by either returning direct website visits, attending events, or subscribing.
Also called conversion metrics, a commitment indicates an informational or financial transaction that involves some sort of risk on the user’s behalf. Audiences who commit are not necessarily diehard fans, but they care enough to intentionally give you information, time, or money.
I dislike the religious/culty connotations of the word "conversion," which implies that a reader has fully given their being and attention and whatever else over to your content. Nah, man, they're just reading, if you're lucky. Commitment is also more accurate, since for many content transactions, the exchange of information does not directly generate revenue.
Commitment (aka conversion) metrics measure whether your potential audience commits to receiving your content on a regular basis by either returning direct website visits, attending events, or subscribing.
For commitment metrics, I recommend tracking
- Return users represent the percentage of users who return to your website during the measured period, assuming readers do not have privacy settings turned on, enable first-party cookie tracking, and have not cleared their cookies.
- Weekly Active Users or Monthly Active Users, depending on your publishing frequency, is extremely helpful for understanding how often people return to read your content. Use this to determine how your publishing schedule affects return users.
- Free subscriptions represents the number of opt-ins to an email list.
- New subscriptions (excluding upgrades) represent the number of people willing to spend cash on your content up-front.
- Form fills represent the number of people interested in a piece of gated content or in contacting your organization. This metric is also called "lead generation" or "demand generation," but I prefer the more accurate, if pejorative, description of "form fills."
- Unique email opens represents the number of users who open an email once received. Because email audiences are often segmented, as well as impacted by privacy changes and email settings, I prefer tracking the growth of email opens over open rates. Especially in our newsletter heyday, unique opens provides a better representation of how your content reaches audiences for long-term growth.
- Event sign-ups or ticket purchases are also worth measuring, especially if they're content-first (i.e., not pure networking events).
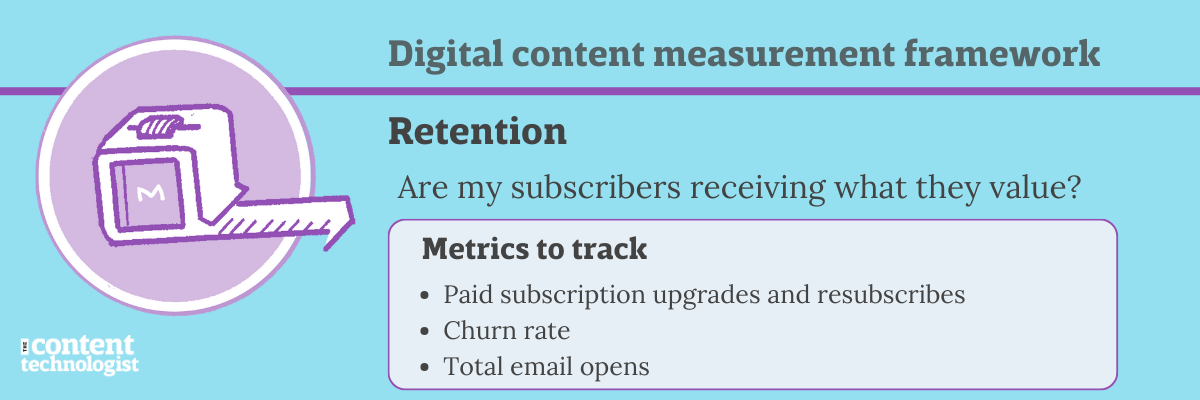
Retention: Are my subscribers receiving what they value?
In marketing applications (as opposed to media and publishing), many content measurement models stop at the conversion or commitment point, with no measurements for whether content supports audiences in sticking with the product.
But retention content helps audiences and customers build deeper relationships with your brand. Study after study finds that subscribed, engaged audiences stick around longer and demonstrate more product loyalty. Most branded content programs have historically been retention plays—John Deere, IBM, and professional associations all created branded magazines to inspire loyalty and usage in existing, committed audiences.
If revenue depends on paid subscribers, understanding audience retention is business-critical.
Not every audience member will be a super fan, share, or recommend your content. But if they're sticking around and reading on occasion, you should measure that action when possible. And if they're falling off because your content isn't meeting their expectations for whatever reason, you should measure that, too.
One caveat, especially for solo creators or teams of one: Do not take unsubscribes personally. Any number of factors can contribute to churn, and it says nothing about your worth as a person. (And if you're attracting 10 new subscribers for every 1 unsubscribe, focus on the new subscribers! Not the unsubscribes!)
Retention determines whether audiences who have converted want to continue accessing or paying for your content.
- Total email opens represents the number of times your email was opened. If audience members forward an email or open in multiple times, some email clients record every time the email was opened... and generally that means an audience member found value in or returned to that email.
- Paid subscription upgrades represent the audience members who like what they've gotten for free so much that they're willing to spend money on your content. (Paid upgrades via content assets also work in SaaS tech applications.)
- Churn rate represents the percentage of users who actively unsubscribe or downgrade their subscriptions.
- Response rate represents the percentage of subscribed users who regularly take an additional action, such as a survey completion or click on a poll submission.
- Resubscribes or return paid customers represents the audiences who are eligible to re-up their paid subscription or presented with an opportunity to re-engage and follow through.
- Survey completions describes the only potential qualitative measurement in the entire measurement model. People who complete surveys tend to have strong feelings about your content one way or another. But especially with email audiences, it's hard to inspire audiences to click into a survey to begin with. If a significant percentage of your audience completes a survey without an incentive, count it as a win.
Whew! What a model. In the next few weeks I'll address questions and provide a couple of examples of using and reading this model. But for the moment... there's plenty to go with here.
Content tech links of the week
The world of content and technology is in massive flux right now. New regulations, new brands, new tools, new research — you're right! It is hard to keep up, and I have a backlog of 36 links from the past few weeks of not sending newsletters.
In lieu of even more content in an already too-long newsletter, here are two essays that I wish I wrote. Each is astounding and speaks to complexity of online businesses in ways I've never seen so clearly articulated before.
- An Ode to Exceedingly Complex Systems by Tara McMullin. Big thoughts about businesses, code, and complexity, especially well-written.
- How Everyone Got Lost in Netflix's Endless Library by Willy Staley in The New York Times. I hate the headline and the frame of the story (I am not particularly lost because I don't watch much Netflix anymore) but love the details of Netflix's economics and shifts over the years. There's a book's worth of detail here packaged in the relative brevity of a magazine article.
The Content Technologist is a newsletter and consultancy based in Minneapolis, working with clients and collaborators around the world. The entire newsletter is written and edited by Deborah Carver, independent content strategy consultant, speaker, and educator.
Advertise with us | Manage your subscription
Affiliate referrals: Ghost publishing system | Bonsai contract/invoicing | The Sample newsletter exchange referral | Writer AI Writing Assistant
Cultural recommendations / personal social: Spotify | Instagram | Letterboxd | PI.FYI
Did you read? is the assorted content at the very bottom of the email. Cultural recommendations, off-kilter thoughts, and quotes from foundational works of media theory we first read in college—all fair game for this section.
I'm finally catching up on the last two seasons of My Brilliant Friend, and I desperately wish the entire show was shoppable. I want to look like a chic Italian 1970s woman.